
Maps and graphs
Complex academic data presented in a friendly way
The brief
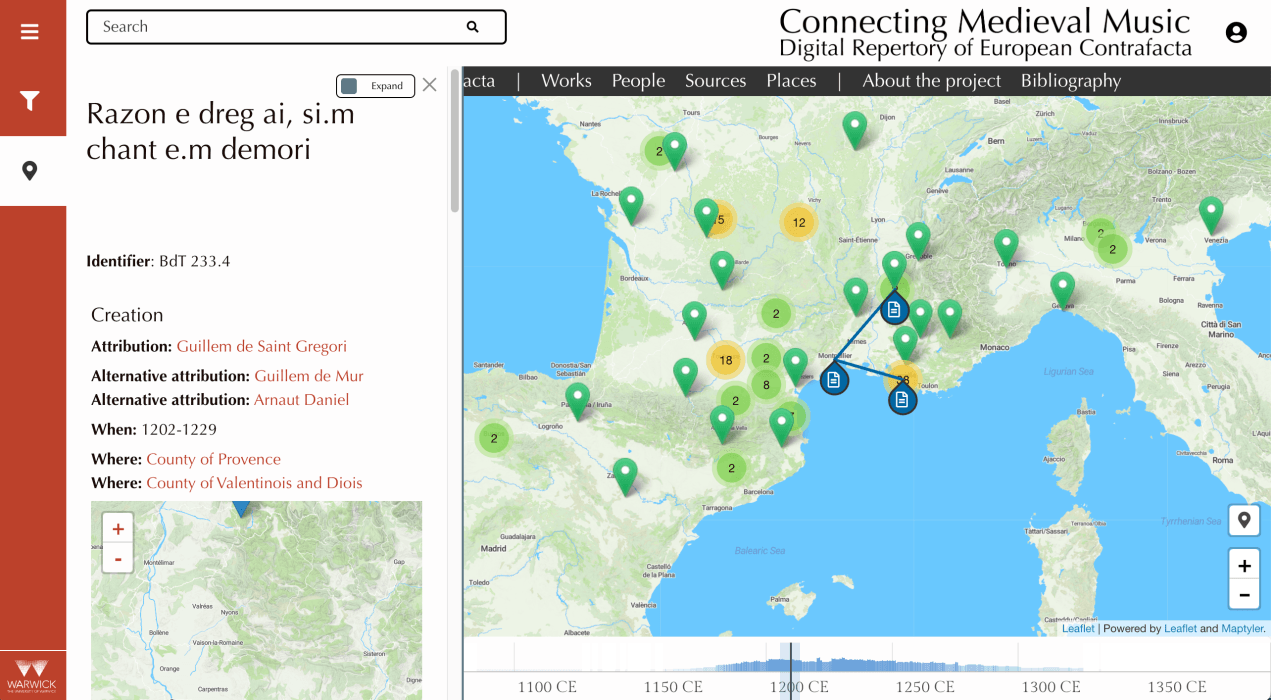
Our clients at Warwick University in the UK wanted to plot both time and space on a map and show the links between those geographic areas.
It needed to be fun to explore the map but still with the academic rigour of the underlying data.
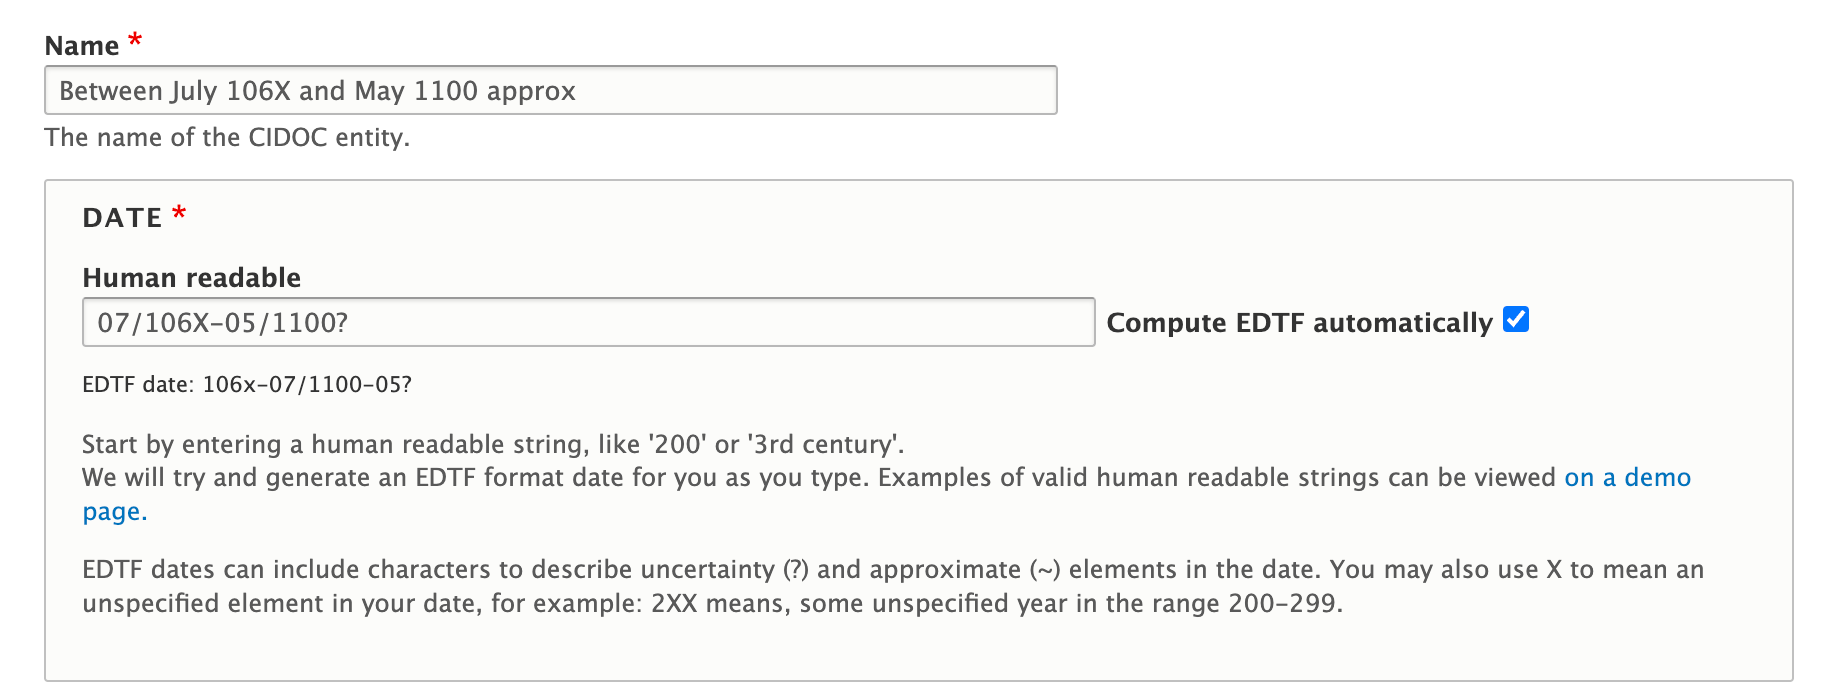
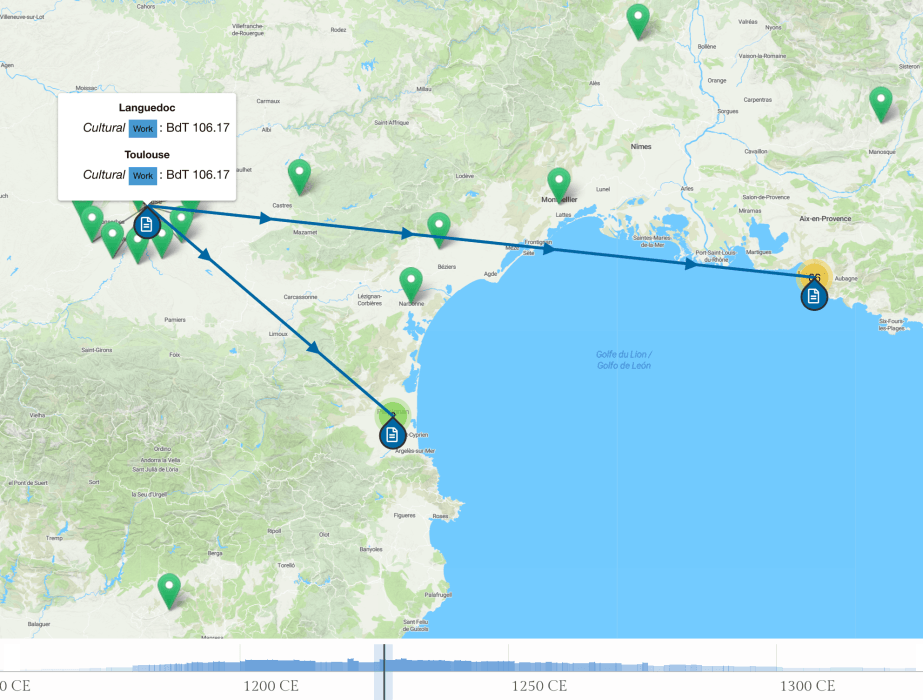
They wanted a simple way to build out a network of data, including both date ranges of events and locations that may be vague and unspecified.
Our approach
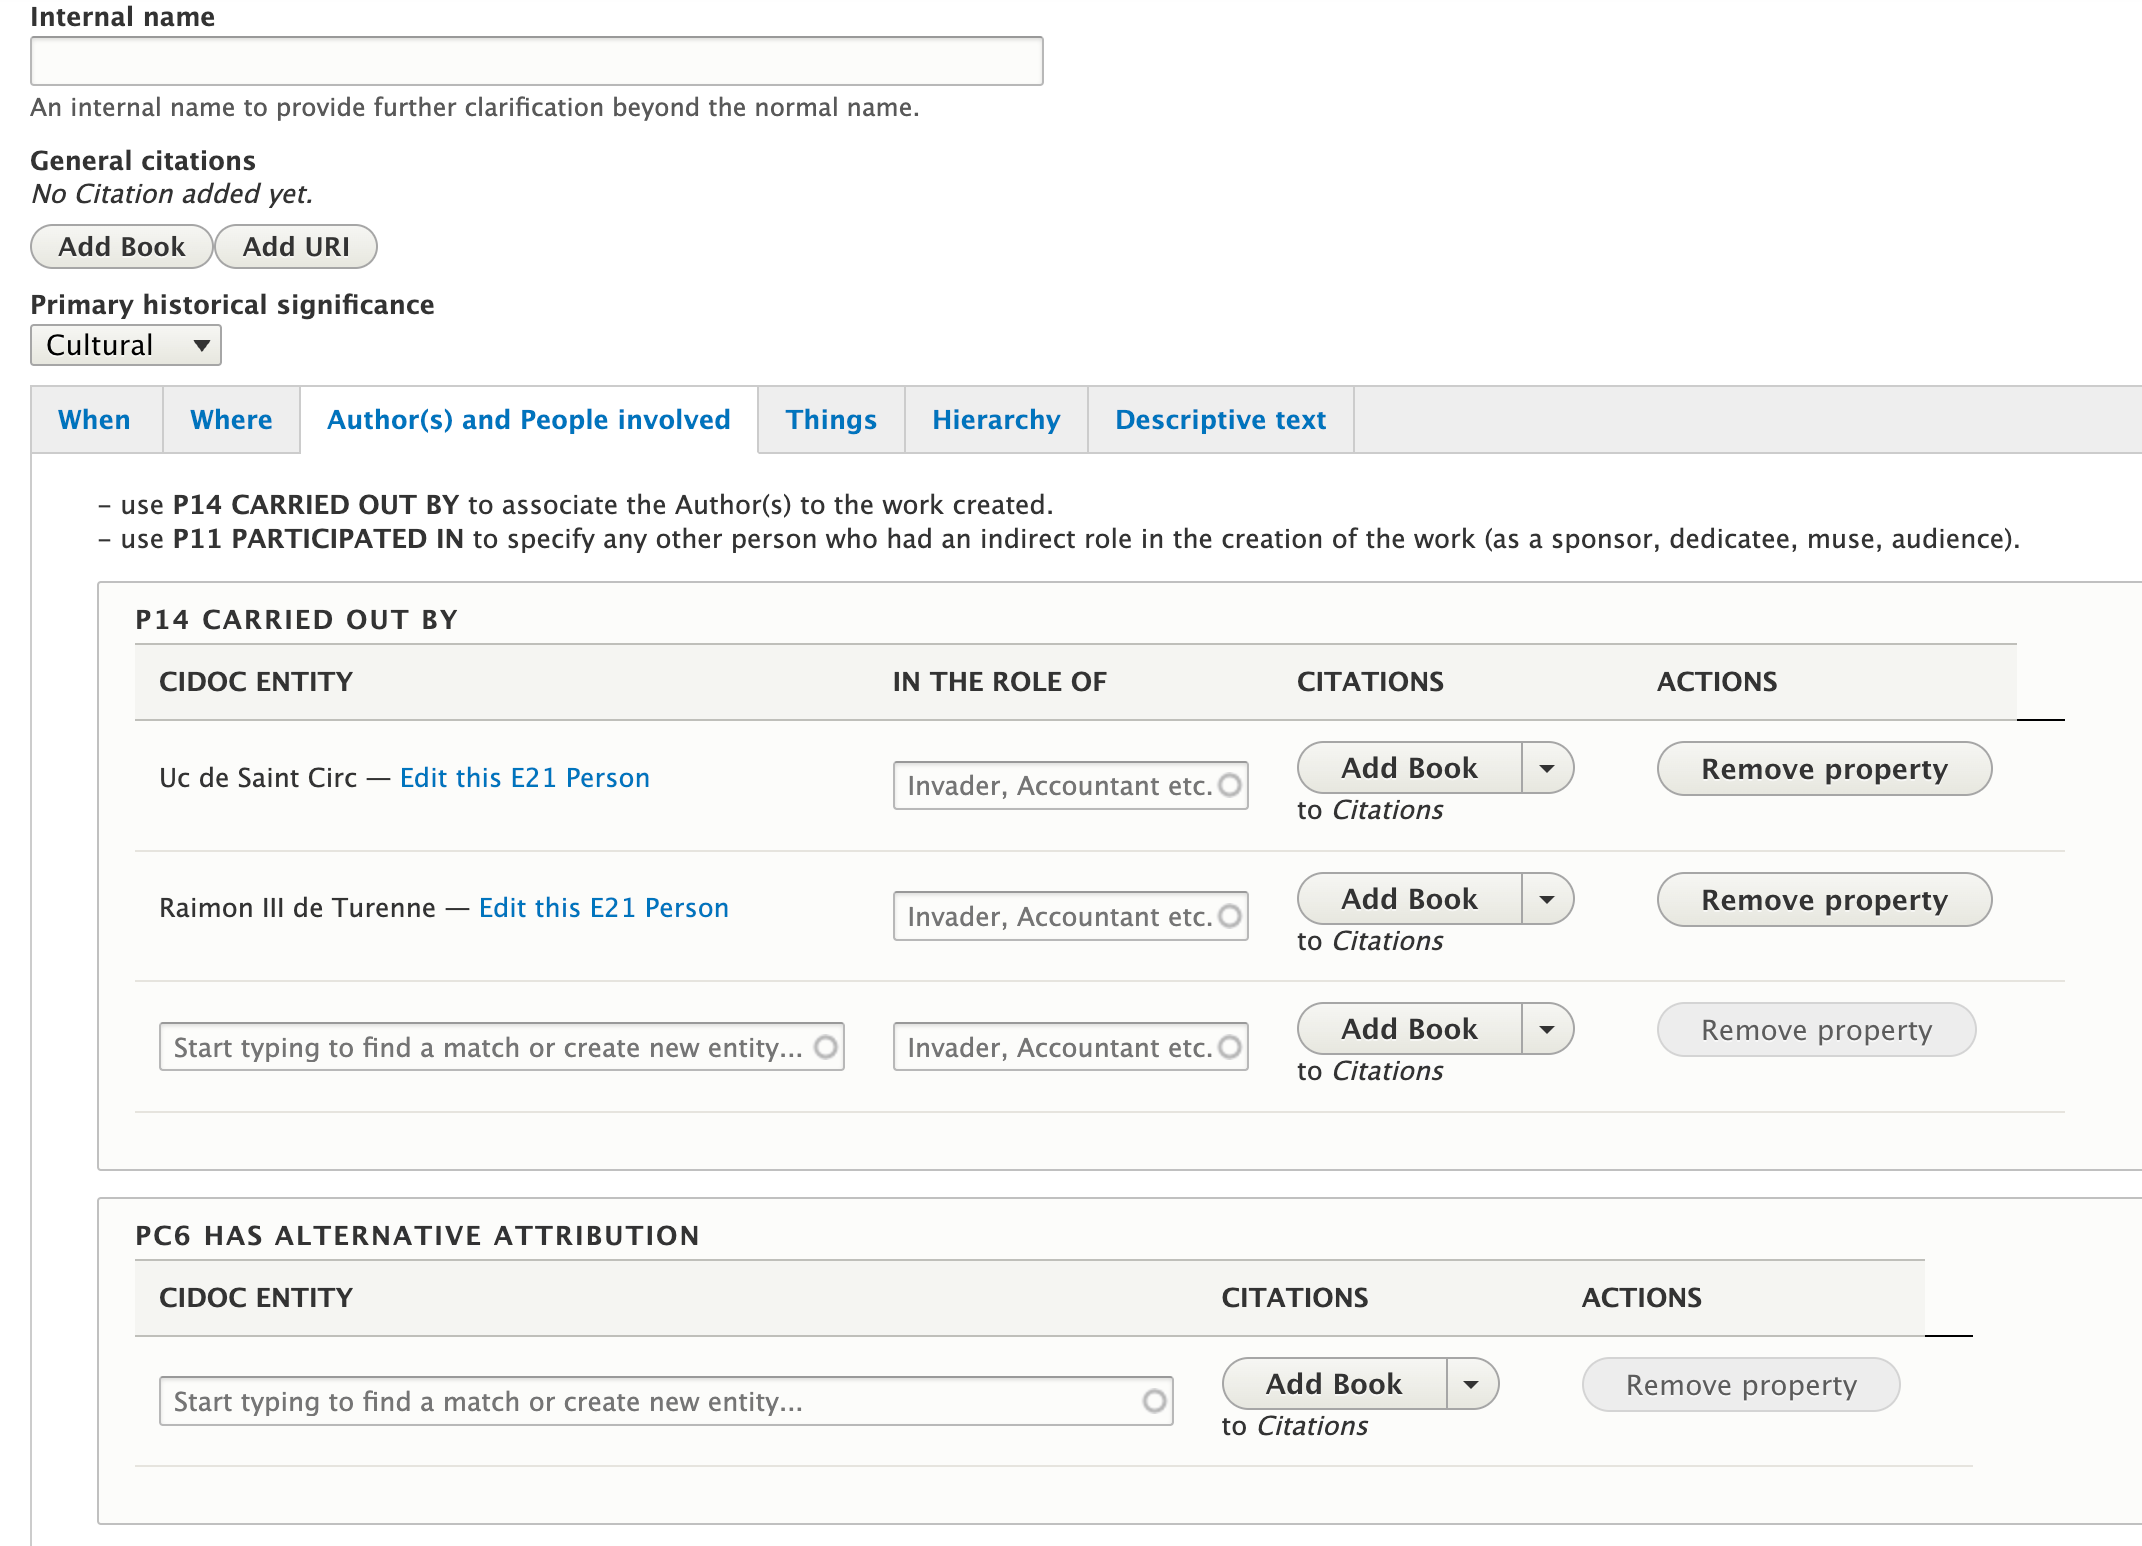
We used Drupal's excellent content modelling systems to build out a network of interconnected events using the CIDOC Conceptual Reference Model.
We modelled this in Drupal in a way that would allow someone to specify which elements of the CIDOC-CRM they wanted to have in the system: balancing the fidelity of the data they could capture with the amount of choices and options that would be visually presented to the editors.
We leveraged the leaflet mapping library and wrote custom plugins for layering on temporal browsing of map pins that appear and disappear as you scrub through a visual timeline of events.
Custom admin widgets
EDTF dates

Temporal maps
Easy scrubbing through thousands of years of history
Top of the list was a way to scrub through history and show only those events that happened in a specific time period. We had to solve the challenge of finding those exact events to show and hiding/showing the events as you scrub while keeping the application performant and working well.
Connections between items on the map were very important and we display custom connections and tooltips to highlight key information at a glance.
Let us help you make maps that will go down in history
In a good way, promise!